Filtering is a generic term for the process of reducing a set of values to a subset that contains only values that you are interested in. In ArteMIS you can use filtering to reduce a Pivot Chart in a report, so that it includes only information that you are interested in.
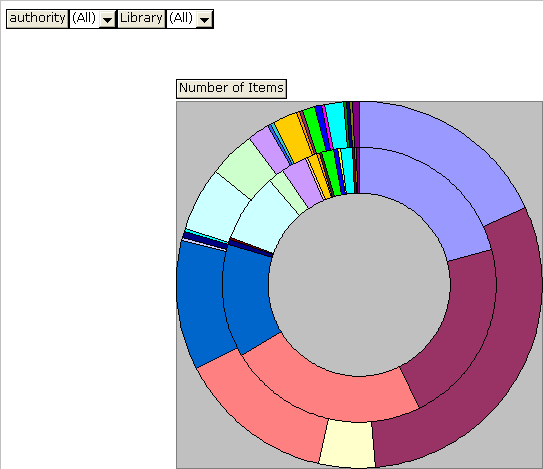
The following example shows an extract from the % of items in stock/on loan/on shelf report (available in the Stock Profiling report category).
You
can filter the chart by using Page Fields outside the Pivot Chart. For
example, to show only figures for items on loan, click Status,
and then tick On Loan, and un-tick
the other items.
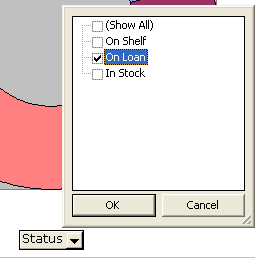
Click
OK to accept the changes.
The Pivot Chart will be filtered to show only entries for On Loan items.
To
filter the Pivot Chart to show only certain libraries, click on Library.
A list of all libraries in the Pivot Chart will appear.
Tick
or un-tick each library in the list. Ticked items will appear in the Pivot
Chart, un-ticked items will not.
Tip: If you tick or un-tick the last visible item in the list, the
list will scroll down automatically, making it quicker to tick or un-tick
a sequence of items in the list.
Click
OK to accept the changes.
The Pivot Chart will be filtered to show only entries for the selected
libraries.
To
remove the Page Field Filter for On Loan,
so that it returns to showing all items, click on Status.
A list of all item statuses in the Pivot Chart will appear.
Tick a filter. In this example tick (Show All).
Click
OK to accept the changes.
The Pivot Chart will be unfiltered to show items of all statuses.
Notice that, if other filters have been applied, these will remain.