Information about the report appears below the report title.
File Size is the size of the Excel report file that will be viewed on your computer.
Date Modified is the date on which the report was last modified or refreshed.
ArteMIS allows you to view reports as Pivot Tables or Database Lists. The availability of each type depends on the report you have selected.
The Reports screen is divided into two sections. The Categories section (on the left side of the screen)contains a list of report types; the right section contains a list of reports of the selected type.
If you already have a report open in Microsoft Excel, close it before viewing a new report that will use Microsoft Excel.
In
the Categories section, click on a report category.
For example, if you want to view a report about library stock, click
Stock Profiling.
The right section will list the available reports of the selected type.
Information about the report appears below the report title.
File Size is the size of the Excel report file that will be viewed
on your computer.
Date Modified is the date on which the report was last modified
or refreshed.
To find out more about a particular report, click the information icon beside it.
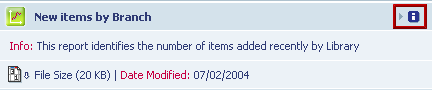
A description of the report will appear below it in the list.
To hide the description, click the information icon again.
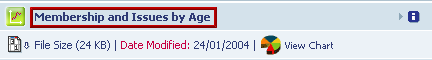
To
view the report, click its title.
If the report is also available as a chart, the chart icon ![]() will appear. To learn more about viewing charts, see Viewing
a Chart.
will appear. To learn more about viewing charts, see Viewing
a Chart.
The report will be created and opened in Microsoft Excel.
If the File Download window appears,
un-tick the Always ask before opening
this type of file check box, then click Open.
Click here to learn about Filtering A Pivot Table.